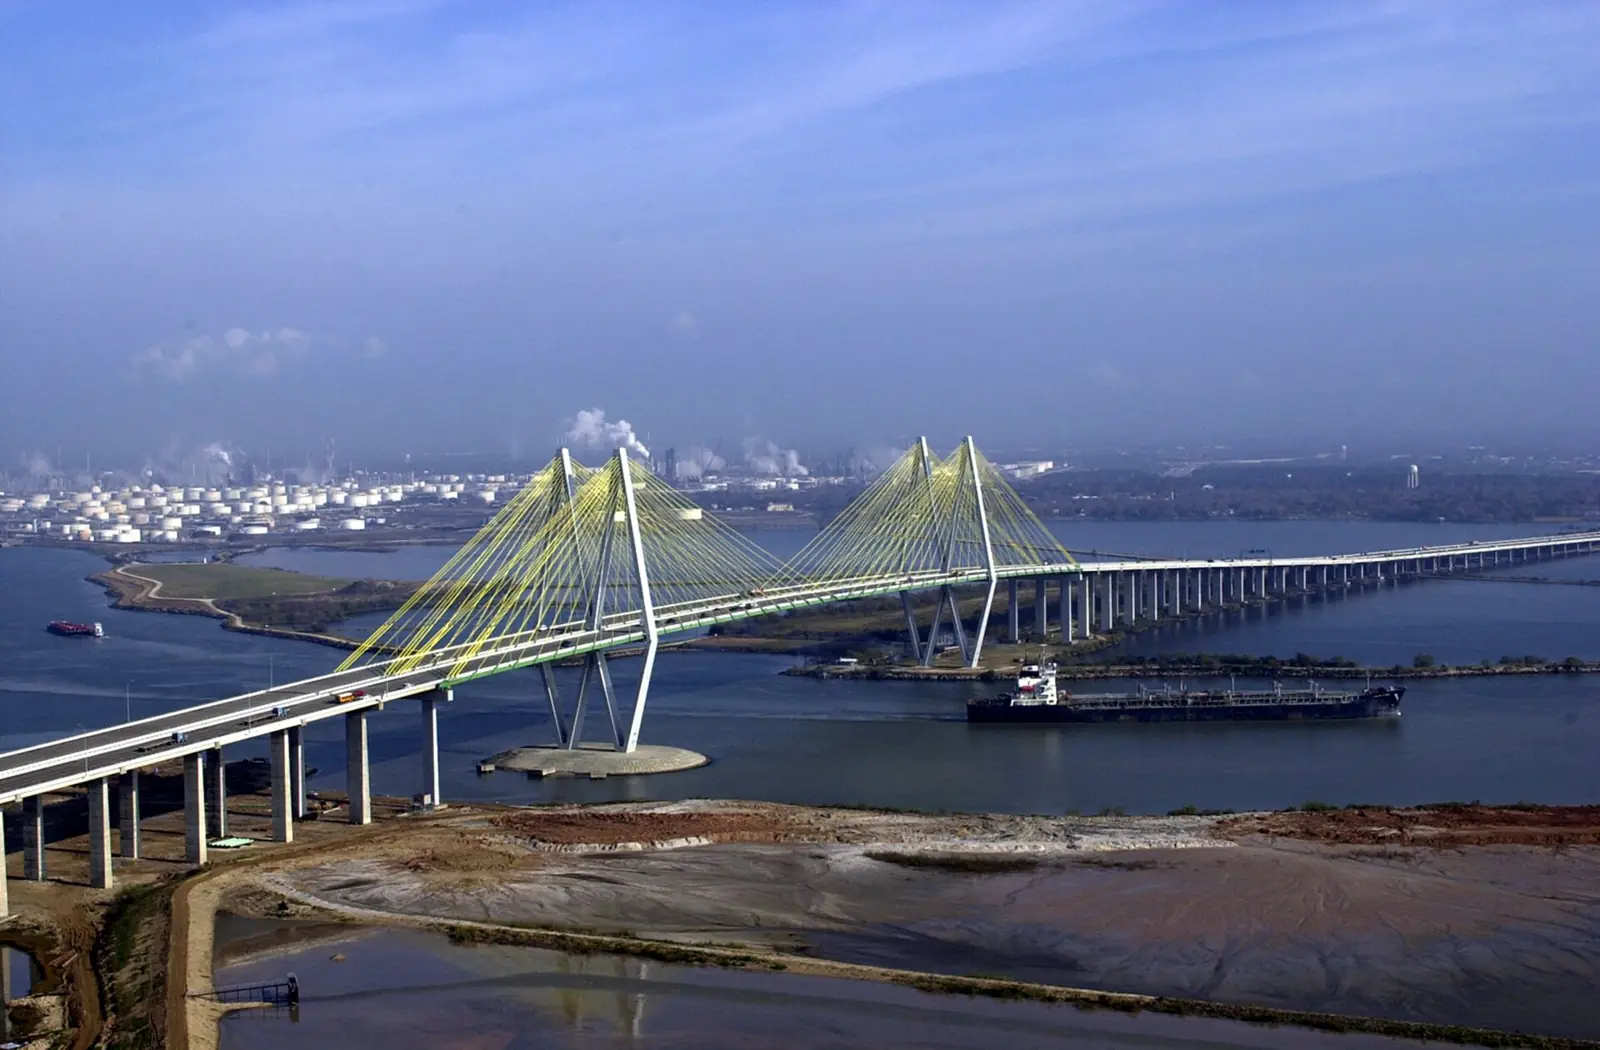
Bridges
| Bridges in the National Bridge Inventory | 57,571 |
|---|---|
| Good condition | 30,323 (52.7%) |
| Fair condition | 26,629 (46.3%) |
| Poor condition | 619 (1.1%) |
| Total deck area | 657,328,794 sq ft |
| Deck area in poor condition | 5,492,151 sq ft (0.8%) |
Texas ranks 49 of 51 (states plus DC) for the share of bridges in poor condition, where 1 is the highest share. Nationally, 6.6% of bridges are rated poor.
A poor share near or below the national rate usually shifts the work toward preservation, inspection and load rating rather than full replacements. Fair-rated bridges (26,629 here) are the ones most likely to slip to poor without timely work, which is why many DOTs fund preservation and inspection contracts alongside replacements.
ASCE report card
The ASCE Texas Section gave the state an overall grade of C in its 2025 report card. Read the full report.
| Category | Grade |
|---|---|
| Aviation | B |
| Bridges | B- |
| Broadband | D+ |
| Dams | D+ |
| Drinking Water | D+ |
| Energy | C |
| Hazardous Waste | C+ |
| Levees | D- |
| Ports | C+ |
| Public Parks | C- |
| Rail | C |
| Roads | C- |
| Solid Waste | C+ |
| Stormwater | C- |
| Transit | D+ |
| Wastewater | D- |
Low-graded categories are where owners should expect agencies and utilities to push capital programs, and where grant applications tend to cluster.
More on Texas for firm owners
- Texas DOT prequalification and procurement
- Texas PE licensure and PDH rules
- Texas civil engineer salaries
- Accredited programs in Texas
- Federal funding programs
Sources: Federal Highway Administration, National Bridge Inventory, 2026 Bridge Condition by Highway System (fhwa.dot.gov); ASCE Infrastructure Report Card state reports (infrastructurereportcard.org), produced by ASCE state sections in the year shown.